


 English
 Russia
 France
 Spain
 Arab

What pressure drop actually means in a compressed air system
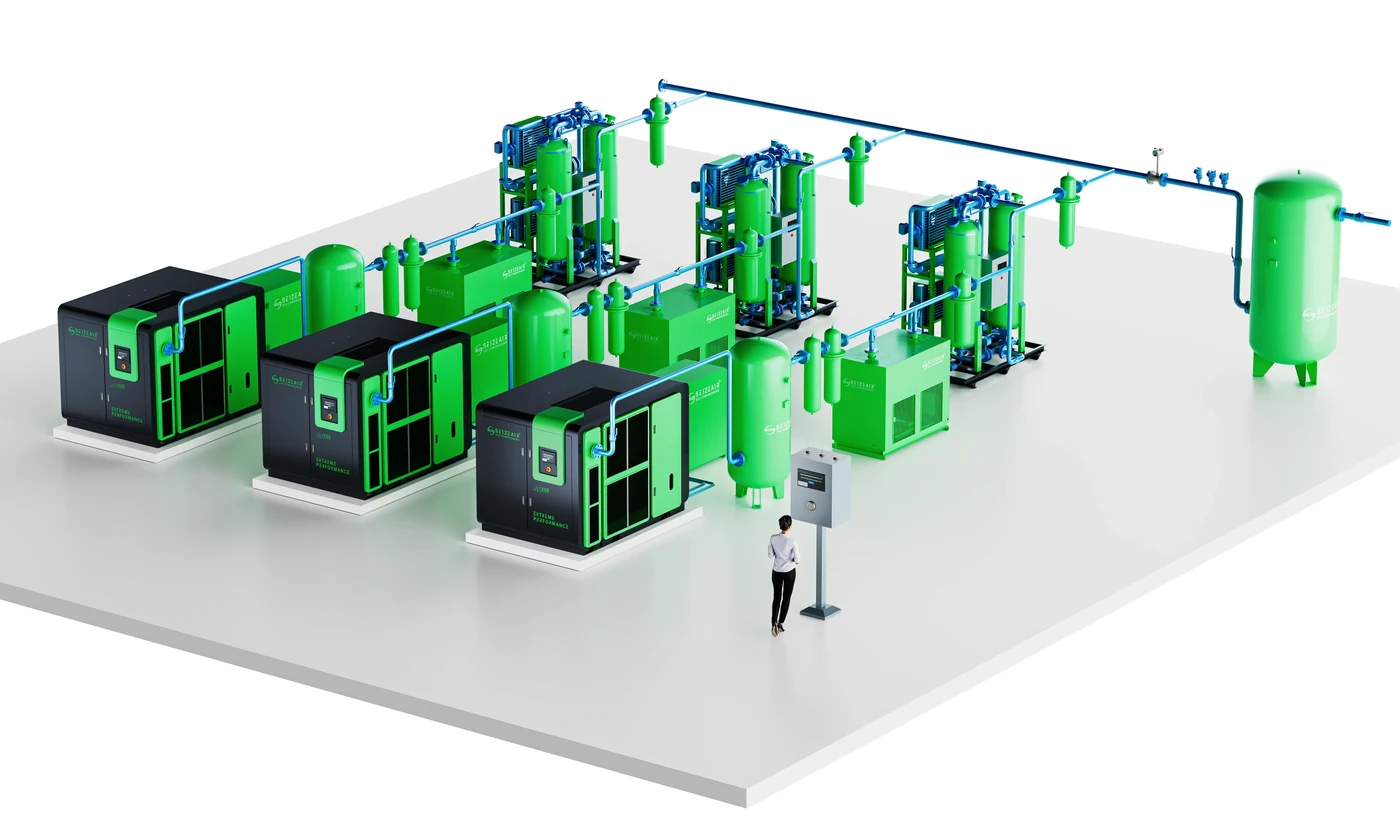
Compressed air is only useful if it arrives at the point of use with enough pressure to do the work. Between the compressor discharge and the tool or actuator, air passes through dryers, filters, pipes, elbows, valves, couplings and hoses. Every one of those components resists flow, and that resistance shows up as a loss of pressure. That loss is what engineers call compressed air pressure drop.
It is easy to confuse pressure drop with a lack of compressor capacity, and the two are often treated with the same expensive remedy: buying a bigger machine. They are not the same problem. Capacity is about how much air you can produce; pressure drop is about how much of the pressure you already paid for gets consumed on the way to where the work happens. In many plants, the second problem is the larger one, and it is usually the cheaper one to fix.
A useful way to think about it: your compressor converts electricity into pressure, and the distribution system quietly spends part of that pressure before it reaches any useful work. When the pressure at the point of use falls short, the common reaction is to raise the compressor discharge setpoint. That works in the short term, but it makes the whole system run at a higher pressure than the application needs, and energy consumption rises with it.
Why pressure drop costs more than it looks
A widely used rule of thumb in compressed air assessments is that raising discharge pressure by about 2 psi (roughly 0.14 bar) increases compressor energy consumption by roughly 1 percent. Expressed over a full bar of unnecessary pressure, that is a meaningful amount of electricity that never reaches a product. Plants that raise setpoints to compensate for pressure losses are, in effect, paying an ongoing energy penalty to work around a distribution problem.
There is a second cost. Higher system pressure pushes more air through every leak, through open blow-offs and through drains. Leakage flow rises with pressure, so a system compensating for pressure drop leaks more than the same system would at a lower, correctly sized setpoint. The two problems reinforce each other.
General engineering guidance for distribution systems is that the total pressure loss from the compressor discharge to the points of use should stay within roughly 10 percent of the compressor discharge pressure. Systems that exceed this are usually not short of capacity — they are losing pressure somewhere specific and findable.
A worked example: tracing a 1.2 bar loss
Abstract advice becomes concrete with an example. The plant below is fictional, but the pattern of numbers is one that compressed air auditors run into constantly. A workshop runs a 7.5 bar system and operators at the far end of the building complain that their tools are sluggish. The discharge gauge reads 7.5 bar; the gauge at the far workstation reads 6.3 bar. That is a loss of 1.2 bar between the compressor room and the point of use — roughly 16 percent of the discharge pressure, well beyond the 10 percent guideline.
Working downstream section by section with the same calibrated gauge under normal production load, the readings come back like this:
| Measurement point | Reading | Loss across the section |
|---|---|---|
| Compressor discharge | 7.50 bar | — |
| After the refrigerated dryer | 7.38 bar | 0.12 bar |
| After the main coalescing filter | 7.05 bar | 0.33 bar |
| At the main header, mid-plant | 7.01 bar | 0.04 bar |
| At the drop to the far workstation | 6.55 bar | 0.46 bar |
| After the workstation regulator and hose | 6.30 bar | 0.25 bar |
The profile tells a story that no single number could. The header itself is fine — only 0.04 bar is lost along it, so the common assumption that “the pipes are too small” would have sent this plant into an expensive repiping project for nothing. The real losses sit in three specific places: a loaded coalescing filter (0.33 bar), the drop and its fittings at the far end (0.46 bar), and the regulator-and-hose combination at the workstation (0.25 bar).
The fixes, in order of cost: change the filter element based on its differential pressure reading, replace the last ten metres of undersized hose and one worn quick coupling with one pipe size larger, and check whether the workstation regulator is sized for the tool’s actual flow rather than whatever was on the shelf. Total cost is a fraction of what repiping the header would have cost, and the discharge setpoint can usually be lowered by roughly a bar afterwards — which is where the energy saving shows up on the electricity bill.
The lesson generalises: measure in sections, and the largest loss will point at a specific, affordable component rather than at the system as a whole.
Where the pressure goes: the usual suspects
Filters and separators
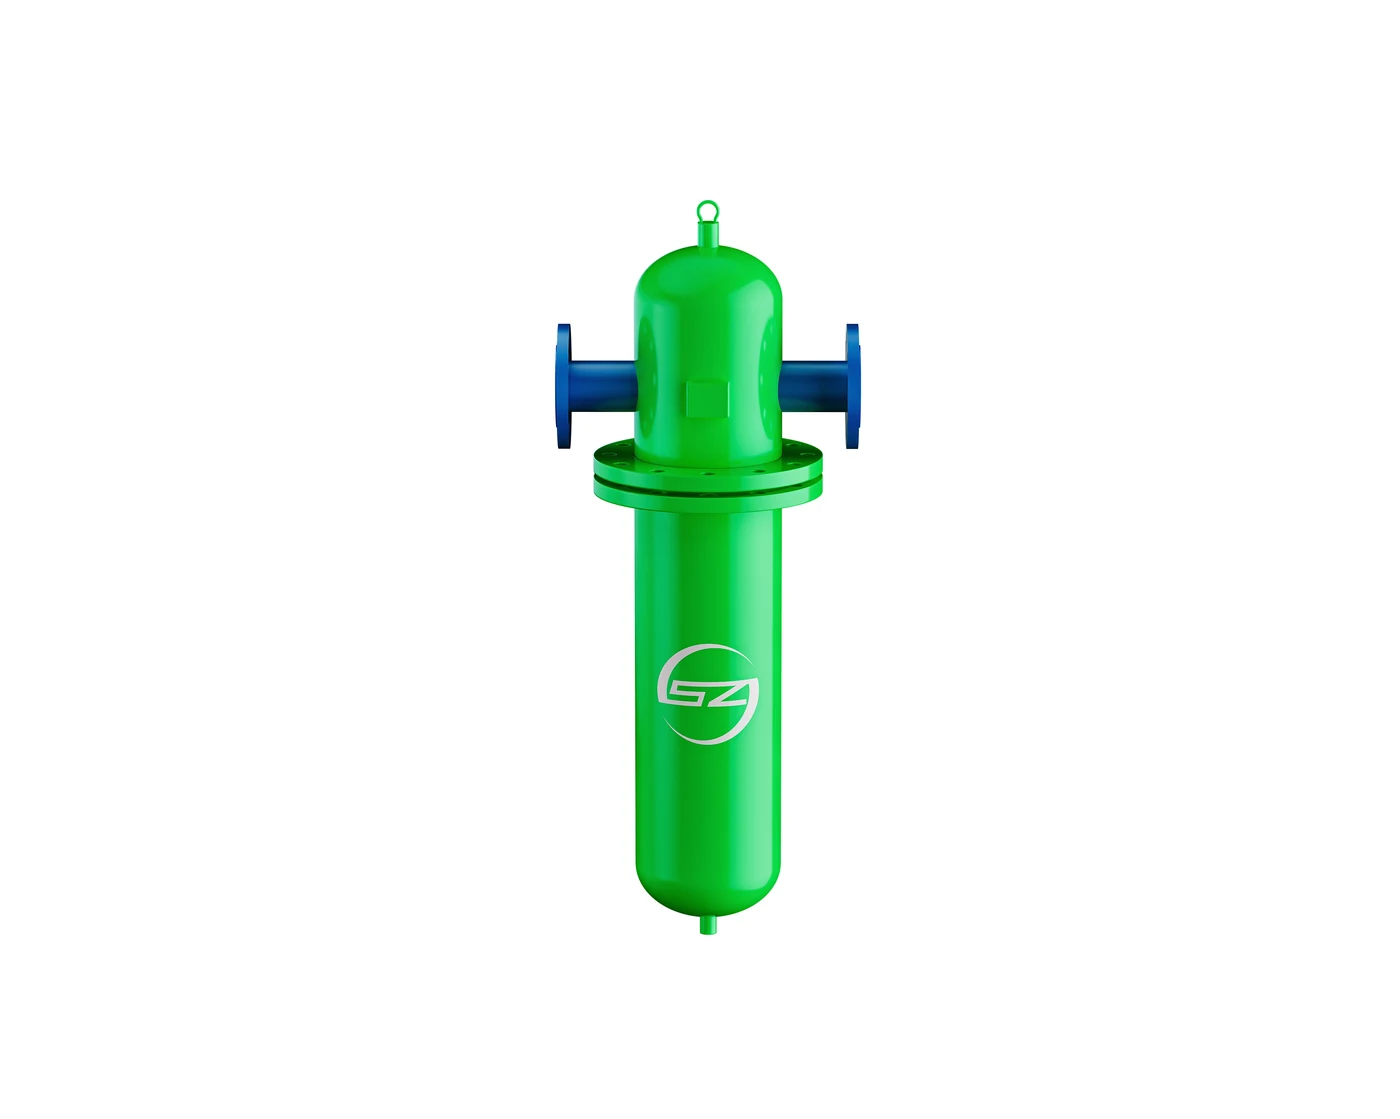
Coalescing filters, particulate filters and oil separators all create a pressure loss that grows as the element loads up. A clogged filter can take several psi out of a system while looking perfectly normal from the outside. This is why differential pressure gauges across filter housings matter more than calendar-based element changes: the gauge tells you when the element is actually costing you pressure.
Dryers
Refrigerated and desiccant dryers both impose a pressure loss. Desiccant dryers also consume purge air, which shows up as capacity loss rather than pressure loss, but the net effect on delivered air is similar. A dryer sized for yesterday’s flow rate becomes a restriction when the plant adds a shift or a new production line.
Undersized or poorly routed piping
Pipe diameter has a strong effect on pressure loss: the loss roughly follows the inverse of the diameter to the fifth power, so a modest reduction in diameter produces a large increase in pressure drop at the same flow. Long runs, excessive elbows and unnecessary reducers all add up. Older systems that grew line by line often end up with a distribution network that made sense at each individual expansion but not as a whole.
Hoses, couplings and quick-connect fittings
The last few metres are frequently the worst part of the system. Undersized hoses, worn quick-connect couplings and cheap fittings can remove more pressure than the entire main header. Tools that “feel weak” are often attached to a hose that is too small or too long.
Regulators and point-of-use restrictions
Every regulator, lubricator and valve in the path takes a share. In plants where each workstation has its own regulator, the cumulative loss is easy to overlook because no single component looks responsible.
Sizing distribution piping: velocity beats habit
Most undersized piping problems come from habit: a branch worked at the flow it was built for, then carried ten more machines as the plant grew. Getting pipe sizing right is not about memorising friction tables. It is about keeping air velocity inside a sensible band, because pressure loss and velocity are tightly linked.
General design practice for compressed air mains is to keep velocity below roughly 6 metres per second in headers, and below about 10 to 15 m/s in short branch and drop sections. Above that band, every elbow and tee starts behaving like a small orifice, and the loss per metre climbs steeply. Velocity depends on only three things: the free air flow, the line pressure, and the internal pipe diameter. Higher pressure packs more air into the same pipe, so the same physical pipe carries more free air at 8 bar than at 5 bar before the velocity limit is reached.
The fifth-power relationship mentioned earlier deserves a practical restatement, because it is the single most useful fact in distribution design. Halving a pipe’s internal diameter multiplies its resistance by roughly thirty-two times at the same flow. Doubling the diameter divides it by the same factor. This is why a ring main built from 2-inch pipe can outperform a dead-end built from 1-inch pipe by an embarrassing margin at the same compressor output, and why upgrading the final 20 metres to a header often costs less than the energy wasted pushing air through it for a single year.
Two practical notes for anyone planning a modification. First, account for the pipe’s internal diameter, not its nominal size: older steel pipe with scale and corrosion can lose 10 to 20 percent of its bore, which quietly multiplies its resistance. Second, count the fittings. A dozen elbows in a short run can add the equivalent of dozens of extra metres of straight pipe, and tees installed as branch takeoffs without a sweep add their own share.
Ring mains versus dead-end layouts
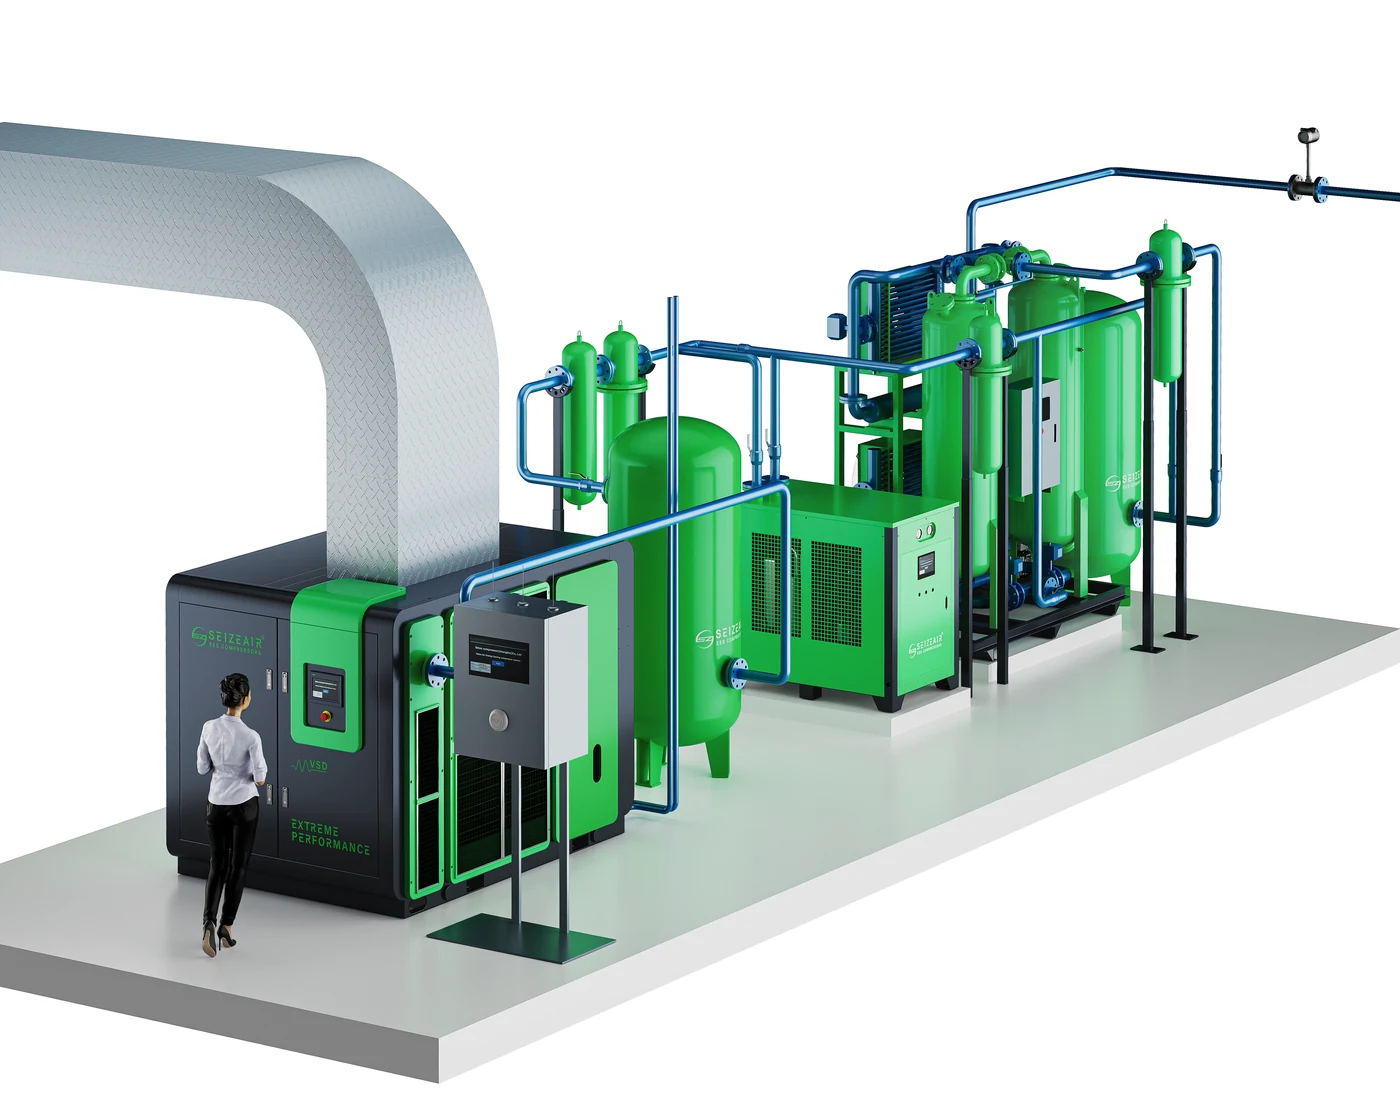
Layout is the quiet half of distribution design. A dead-end system feeds every point of use from a single run of pipe that gets progressively farther from the compressor. The far end of a dead end sees the lowest pressure, the least flow reserve, and — because air can only arrive from one direction — the largest sensitivity to any restriction anywhere upstream of it.
A ring main loops the header back on itself so that air reaches every takeoff from two directions. At any given flow, the effective resistance is lower, and the far corners of the system stop being the problem corners. For plants with points of use spread around a building, or with equipment that is sensitive to pressure fluctuation, the loop is usually the layout that lets everything else in the system be sized more modestly.
Retrofitting a loop does not have to be a full repipe. Many plants close the ring by adding one return run along the opposite wall, sized for the far half of the demand, and gain most of the benefit without touching the original header. As with everything in this article, the sequence is measure first, then modify — the section profile will show whether the header or the drops are actually the restriction before anyone commits to steel.
Filters: getting real value from the differential gauge
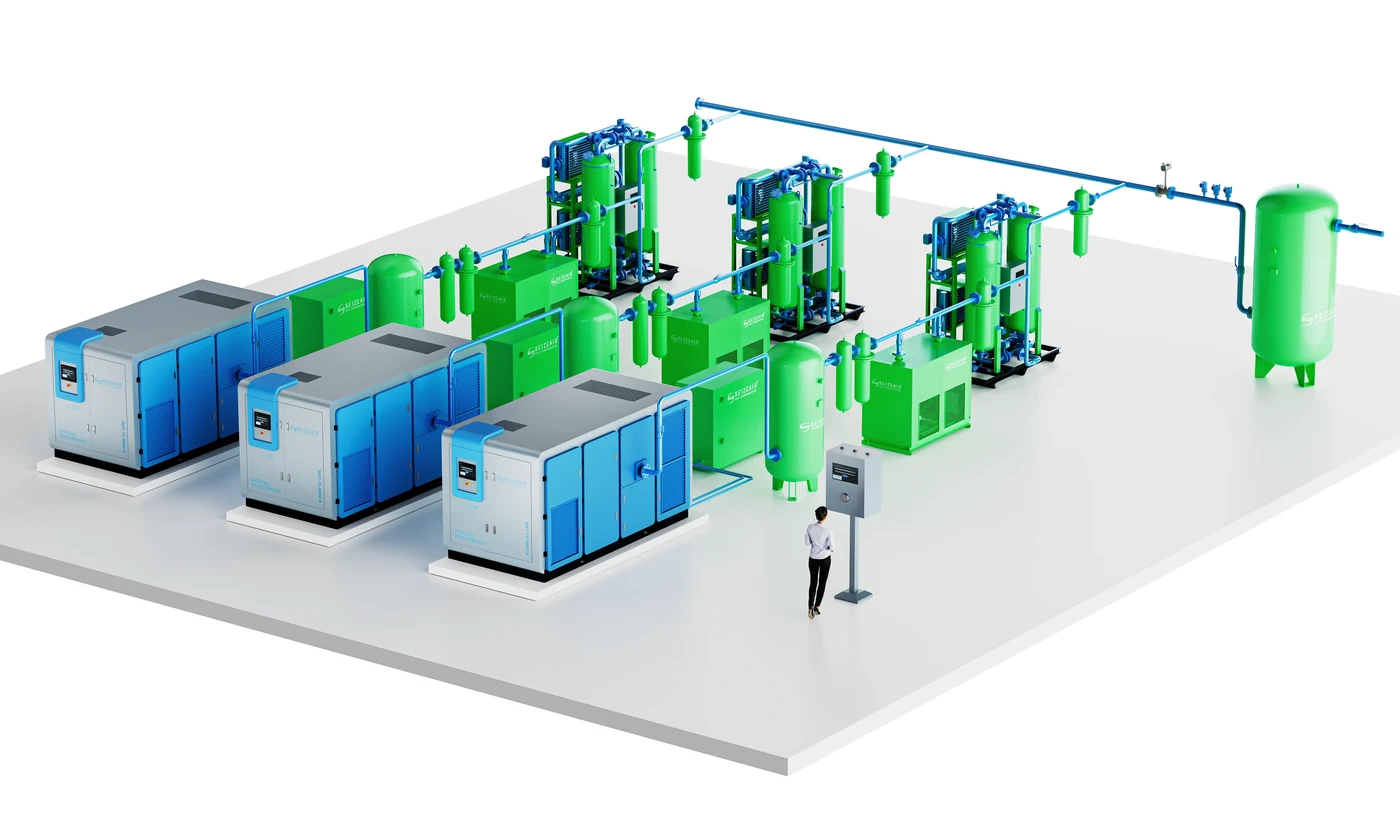
Filter elements deserve their own attention because they are the one distribution component that changes state week by week. A clean coalescing element might cost a few tenths of a psi; the same element at end of life can cost a full psi or more while the plant is paying for that loss continuously.
The practical discipline is simple. Fit a differential pressure indicator across each filter housing, record the reading during the weekly walk-round, and replace the element when the differential reaches the manufacturer’s recommended change point — not on a fixed calendar. Elements replaced too early waste money; elements replaced too late cost more in pressure than the element is worth. Somewhere between those two errors is the correct policy, and the differential gauge is what locates it.
One caution: a differential reading that suddenly spikes is not always a dirty element. A collapsed element, a blocked automatic drain backing condensate into the housing, or a flow rate far above the filter’s rating can all produce the same symptom. The gauge identifies that a filter is restricting; opening the housing identifies why.
How to measure it properly
Guessing is what makes compressed air pressure drop expensive. Measuring it is straightforward and needs only calibrated gauges and a plan.
- Establish the baseline. Record the pressure at the compressor discharge and at the furthest, most demanding point of use, with the system running under normal production load.
- Measure in sections. Work downstream from the compressor: after the dryer, after each filter housing, at the header, at each drop and at the point of use. The section with the largest loss is where the money is.
- Use the same gauge or calibrated gauges. Two unmatched gauges can create a pressure drop that exists only on paper.
- Measure under real load. Pressure drop varies with flow, so readings taken during a break or a shift change will understate the problem.
- Repeat after changes. A repair that does not move the number was not the cause.
Recording these numbers over a full production cycle gives you a system profile you can compare against later. It also gives you an objective way to decide whether a proposed piping modification was worth it.
What to fix, in order
Because pressure drop is cumulative, the cheapest fixes are usually the ones closest to the point of use.
- Replace loaded filter elements based on differential pressure, not on a fixed calendar interval.
- Right-size hoses and fittings at the workstation; this often delivers an immediate improvement in tool performance.
- Repair leaks so that the pressure you recover is not simply lost again downstream. Leakage and pressure drop are usually treated together for this reason.
- Check dryer and separator condition against current actual flow, not the flow the machine was originally specified for.
- Address the header last: adding capacity or looping the main is the most expensive option and should follow the cheap fixes, not precede them.
Once restrictions are removed, the discharge setpoint can usually be lowered back toward what the application genuinely requires. That is where the ongoing energy saving comes from — not from the repair itself, but from no longer having to push the whole system to compensate.
Seasonal effects: when the building changes the answer
Pressure profiles are not frozen in time. Winter is the season that catches plants out, for two reasons that pull in opposite directions. Cold intake air actually helps the compressor — denser intake means the machine delivers its flow more easily — but cold pipework in unheated sections changes how condensate behaves, and condensate that pools in a low point of a dead-end leg is a flow restriction in its own right. A dip leg that was merely inefficient in summer can ice up or slug water in January.
Summer brings the opposite pattern. Warm compressor-room air raises the inlet temperature to dryers and filters, reducing their effective capacity and increasing their resistance. A treatment train that measured 0.15 bar of loss in March can measure noticeably more in August with no physical change at all, simply because hotter air is harder to treat at the same flow.
The practical conclusion is to profile the system in more than one season, or at least to expect the numbers to move with the weather. A plant that measures only in spring carries an optimistic picture of its own distribution for the rest of the year.
Condensate drains: the restriction nobody schedules
Drains sit at the bottom of every receiver, filter housing and dryer, and they are the least glamorous component in the plant — which is exactly why they end up in the pressure-loss story so often. A drain that fails closed lets condensate accumulate until liquid is being carried into the airstream and sitting in low points of the piping, where it restricts flow and produces the classic seasonal complaint of water at the tools. A drain that fails open is worse in a different way: it leaks compressed air continuously, which drags the effective pressure down at exactly the workstations that are already farthest from the compressor.
Both failure modes show up in the section profile. Liquid pooling shows as a growing loss across a specific low-point section; a failed-open drain shows as the compressor loading more often than the production pattern explains. Neither looks like a piping problem on the gauge, which is why the weekly walk-round should include a quick function check of every drain rather than waiting for one to announce itself.
When liquid is suspected in a line, the physical fix is as important as the repair: low points should have takeoffs from the top of the pipe rather than the bottom, and drops should rise from above wherever the layout allows. Repiping a single poorly taken drop often removes more restriction than a week of setpoint adjustments, and it stays fixed.
A maintenance cadence that keeps the losses out
None of this is a one-off exercise, but it does not need to be a burden either. The cadence below is what a plant needs so that distribution losses stay found rather than returning unannounced.
| Interval | Action |
|---|---|
| Weekly | Walk-round with a log sheet: differential readings across each filter, discharge and far-end pressures, drain function check. |
| Monthly | Re-measure one or two full section profiles under load; compare against the seasonal baseline; investigate any section whose loss has grown. |
| Quarterly | Ultrasonic leak survey of the areas with the most fittings and couplings; check drop and hose condition at the workstations that run the longest hours. |
| Annually | Full system profile in a different season from the baseline; review setpoints against the clean-system numbers; review pipe condition and future demand changes with the section data in hand. |
The habit matters more than the exact intervals. Plants that keep the numbers find restrictions when they are cheap; plants that measure only when complaints arrive are already paying the penalty.
Pressure drop and compressor selection
Selecting a compressor on flow and pressure alone ignores how much of that pressure will be consumed by compressed air pressure drop in distribution. A realistic specification starts from the pressure required at the point of use, then adds the measured or estimated losses of each component in the path. Plants that skip this step tend to specify a higher discharge pressure than they need and carry that penalty for the life of the machine.
If you are at the stage of specifying equipment, it is worth reading the comparison of screw versus reciprocating compressor designs, since the two behave differently under variable demand, and the overview of energy efficiency in industrial air compressors, which puts pressure decisions in the context of total operating cost.
For applications where air quality is part of the specification, the oil-free air compressor selection guide covers how treatment equipment and purity requirements interact with pressure budgets. Plants looking at the wider efficiency picture can also review practical steps for improving factory efficiency and the discussion of intelligent management and energy monitoring, which is what turns a one-off measurement into ongoing control.
Understanding how compressor technology developed helps explain why modern systems are specified differently today; the background in the evolution of air compressors is a useful starting point.
When to bring the equipment supplier into the conversation
Most of the work described here needs no external help: gauges, a log sheet and an afternoon of walking the line will find the majority of losses. There are points, though, where a supplier’s input changes the outcome. If the section profile shows the loss sits inside the treatment train rather than the pipework, the dryer and filter sizing needs to be reviewed against the plant’s current and planned flow — and that review is worth doing with real performance curves rather than nameplate assumptions. If the profile is stable but the setpoint still sits higher than the application needs, the compressor’s control strategy and the possibility of variable-speed operation become part of the discussion, because the penalty of running at unnecessary pressure is smaller for some control types than others.
The third conversation worth having is about the future. A distribution profile measured today is only valid for today’s demand. If a new line, a new building or a change of shift pattern is planned, the same section data becomes the basis for deciding what to upsize, where to add storage, and whether the ring main should be closed before the new load arrives. Suppliers who are given the profile, rather than just the complaint, can answer those questions with numbers instead of guesswork.
Frequently asked questions
How much pressure loss is acceptable in a compressed air system?
A common target is to keep the total loss from the compressor discharge to the point of use within about 10 percent of the discharge pressure. What matters more than the exact figure is the trend: a system whose profile is stable and small is healthy, and a system whose loss grows between measurements is telling you where to look next.
Should I raise the compressor pressure setting to fix weak tools at the far end of the plant?
It works as a stopgap and it is the most expensive way to solve the problem. Raising the setpoint raises the pressure everywhere, costs energy across the whole system, pushes more air through every leak, and compensates for a restriction instead of removing it. Measure the section profile first; the restriction is usually a specific component that costs far less to fix than the ongoing energy penalty of a raised setpoint.
Does a bigger air receiver help with pressure drop?
Not directly, and it is worth separating the two concepts. A receiver buffers demand peaks and stabilises pressure fluctuation over short cycles; it does not reduce the resistance that air meets in the pipework. If the complaint is a steady loss of pressure along the distribution, the fix is in the sections where the loss occurs. If the complaint is pressure sagging during short, sharp demand spikes, then storage — sized and placed correctly, including receivers near large intermittent users — is the right tool.
Why is the pressure loss across my filter growing even after I changed the element?
Check three things before blaming the replacement element. First, confirm the element is the correct flow rating for the housing and the actual flow, not just the right thread. Second, check the automatic drain: a drain that fails open or closed changes what sits inside the housing. Third, check whether system flow has grown since the filter was specified — a filter that is fine at the flow it was bought for becomes a restriction when a new line starts up.
Can pipe diameter really change the energy bill that much?
Yes, because the resistance scales with roughly the inverse fifth power of diameter at a given flow. In a system running thousands of hours a year, the difference between pushing air through an undersized header and a correctly sized one shows up as a continuous difference in compressor energy, not a one-off cost. It is also why the cheapest distribution upgrade is often only the last section of pipe before the worst-served workstations.
How often should we re-measure the system profile?
Once per season is a workable rhythm for most plants, with quick weekly spot-checks of the two reference points — discharge and the farthest point of use. More frequent full profiles are useful after modifications, when commissioning new equipment, or whenever the production load pattern changes materially.
Do leaks cause pressure drop, or does pressure drop cause leaks?
Both directions matter. Leaks are flow paths that waste the pressure you generate, and higher system pressure drives more air through them. Meanwhile the same raised setpoint that compensates for a restriction also feeds the leaks. This is why leak repair and restriction removal belong in the same programme: fixing one without the other lets the remaining problem quietly rebuild the penalty.
A practical checklist
- Measure pressure at discharge and at the worst point of use, under load, with calibrated gauges.
- Walk the system section by section and record each drop.
- Fix the largest losses first, starting at the point of use.
- Bring filter element changes under differential-pressure control.
- Repair leaks before, or at the same time as, raising any setpoint.
- Keep pipe velocity inside the recommended band when planning extensions.
- Re-profile the system in a different season from your baseline.
- Lower the discharge setpoint once restrictions are removed, and re-measure.
- Record the new profile so future changes can be compared against it.
Compressed air pressure drop is not a minor technical detail. It is one of the few problems in a plant where a measurement exercise with two gauges can lead to a permanent reduction in energy cost without changing a single piece of production equipment. The organisations that assess compressed air systems systematically — such as the Compressed Air Challenge training and resources — treat it as one of the first things to check, and that ordering is worth adopting.
If you want a second opinion on your system profile, share your pressure readings at discharge and at the furthest point of use, together with the flow rate you are running at, and the losses can be traced back to specific components.